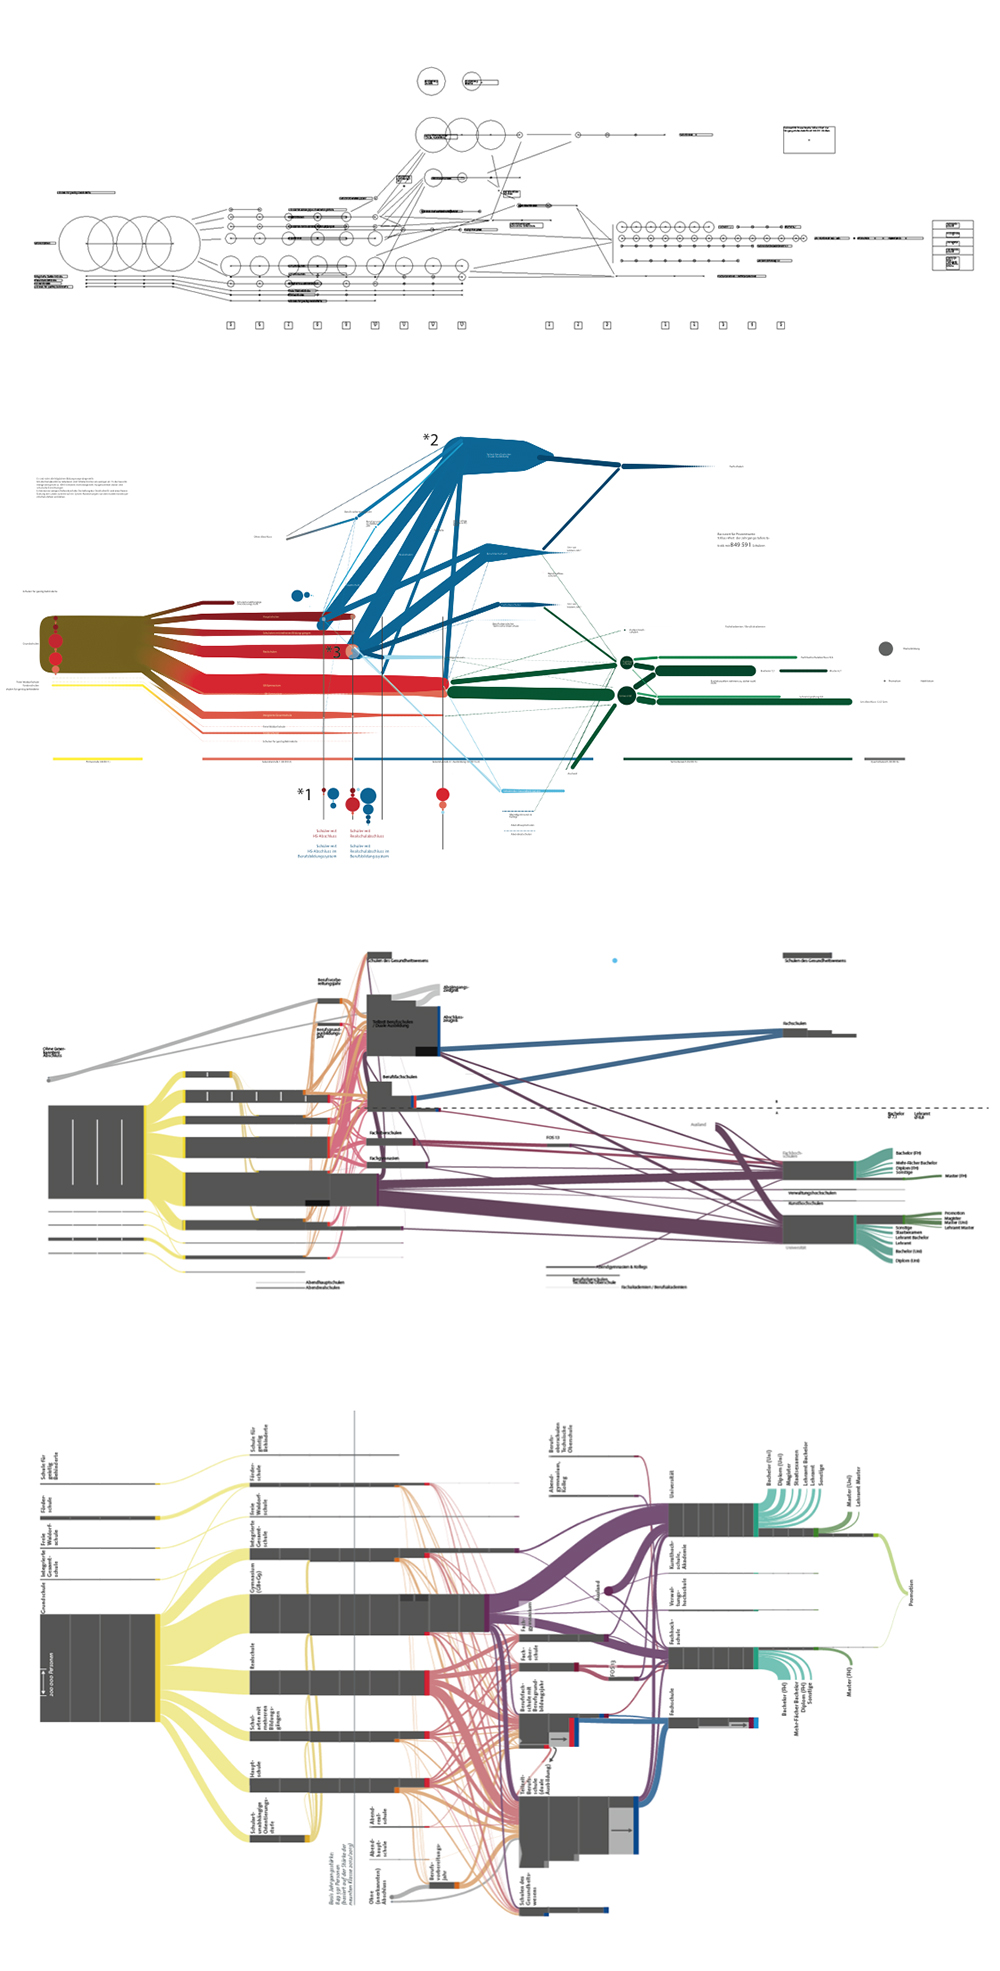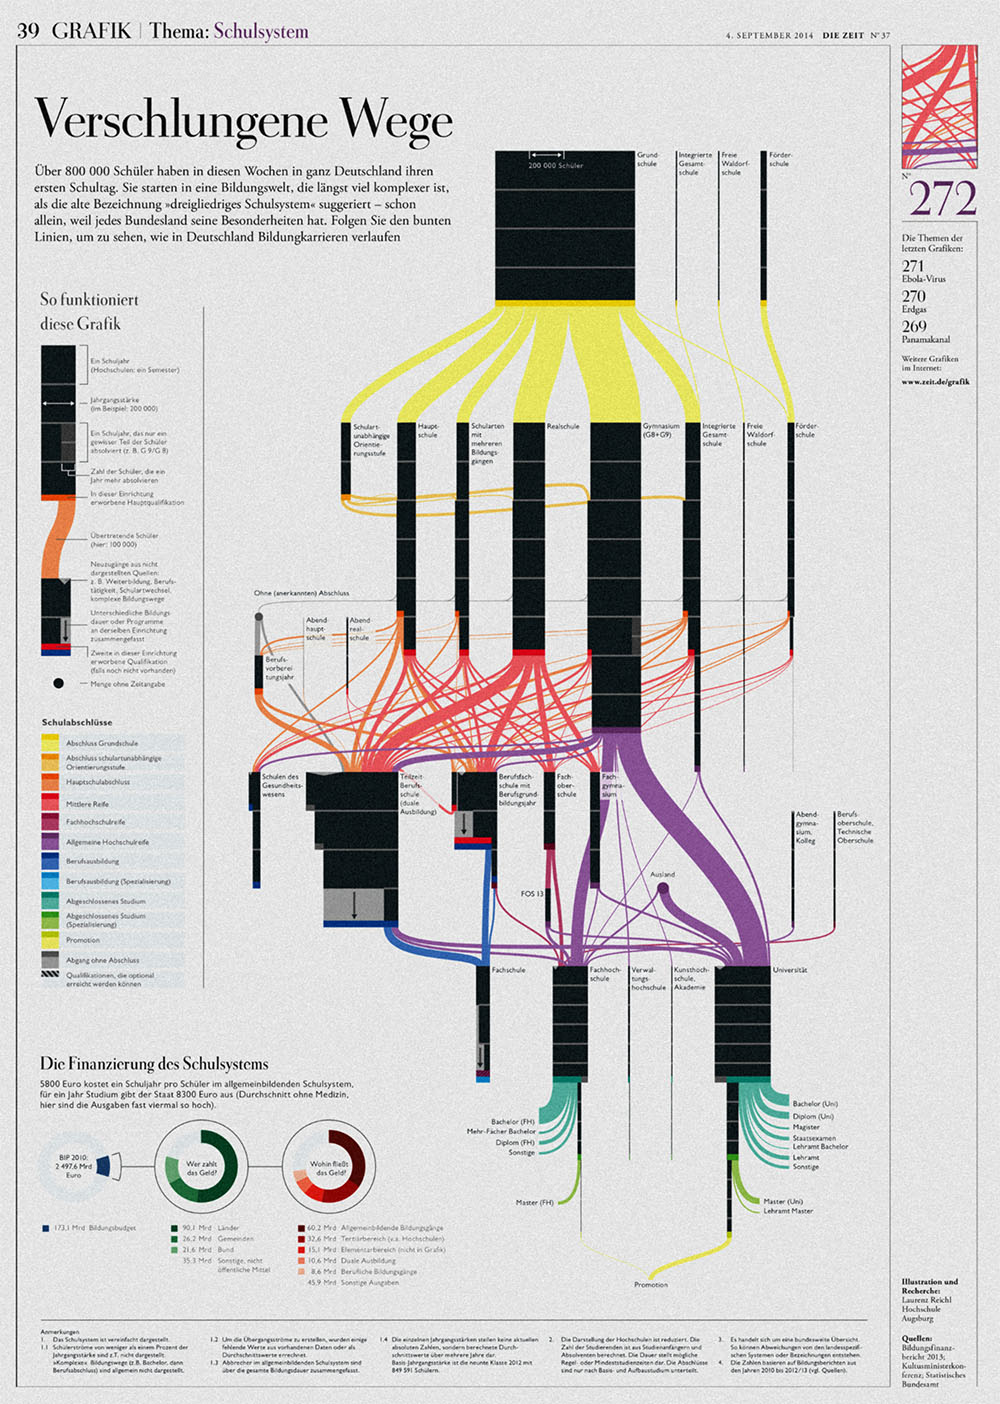
In an information graphics project during my studies I had the chance to create a graphic for the well-known newspaper »Die Zeit«
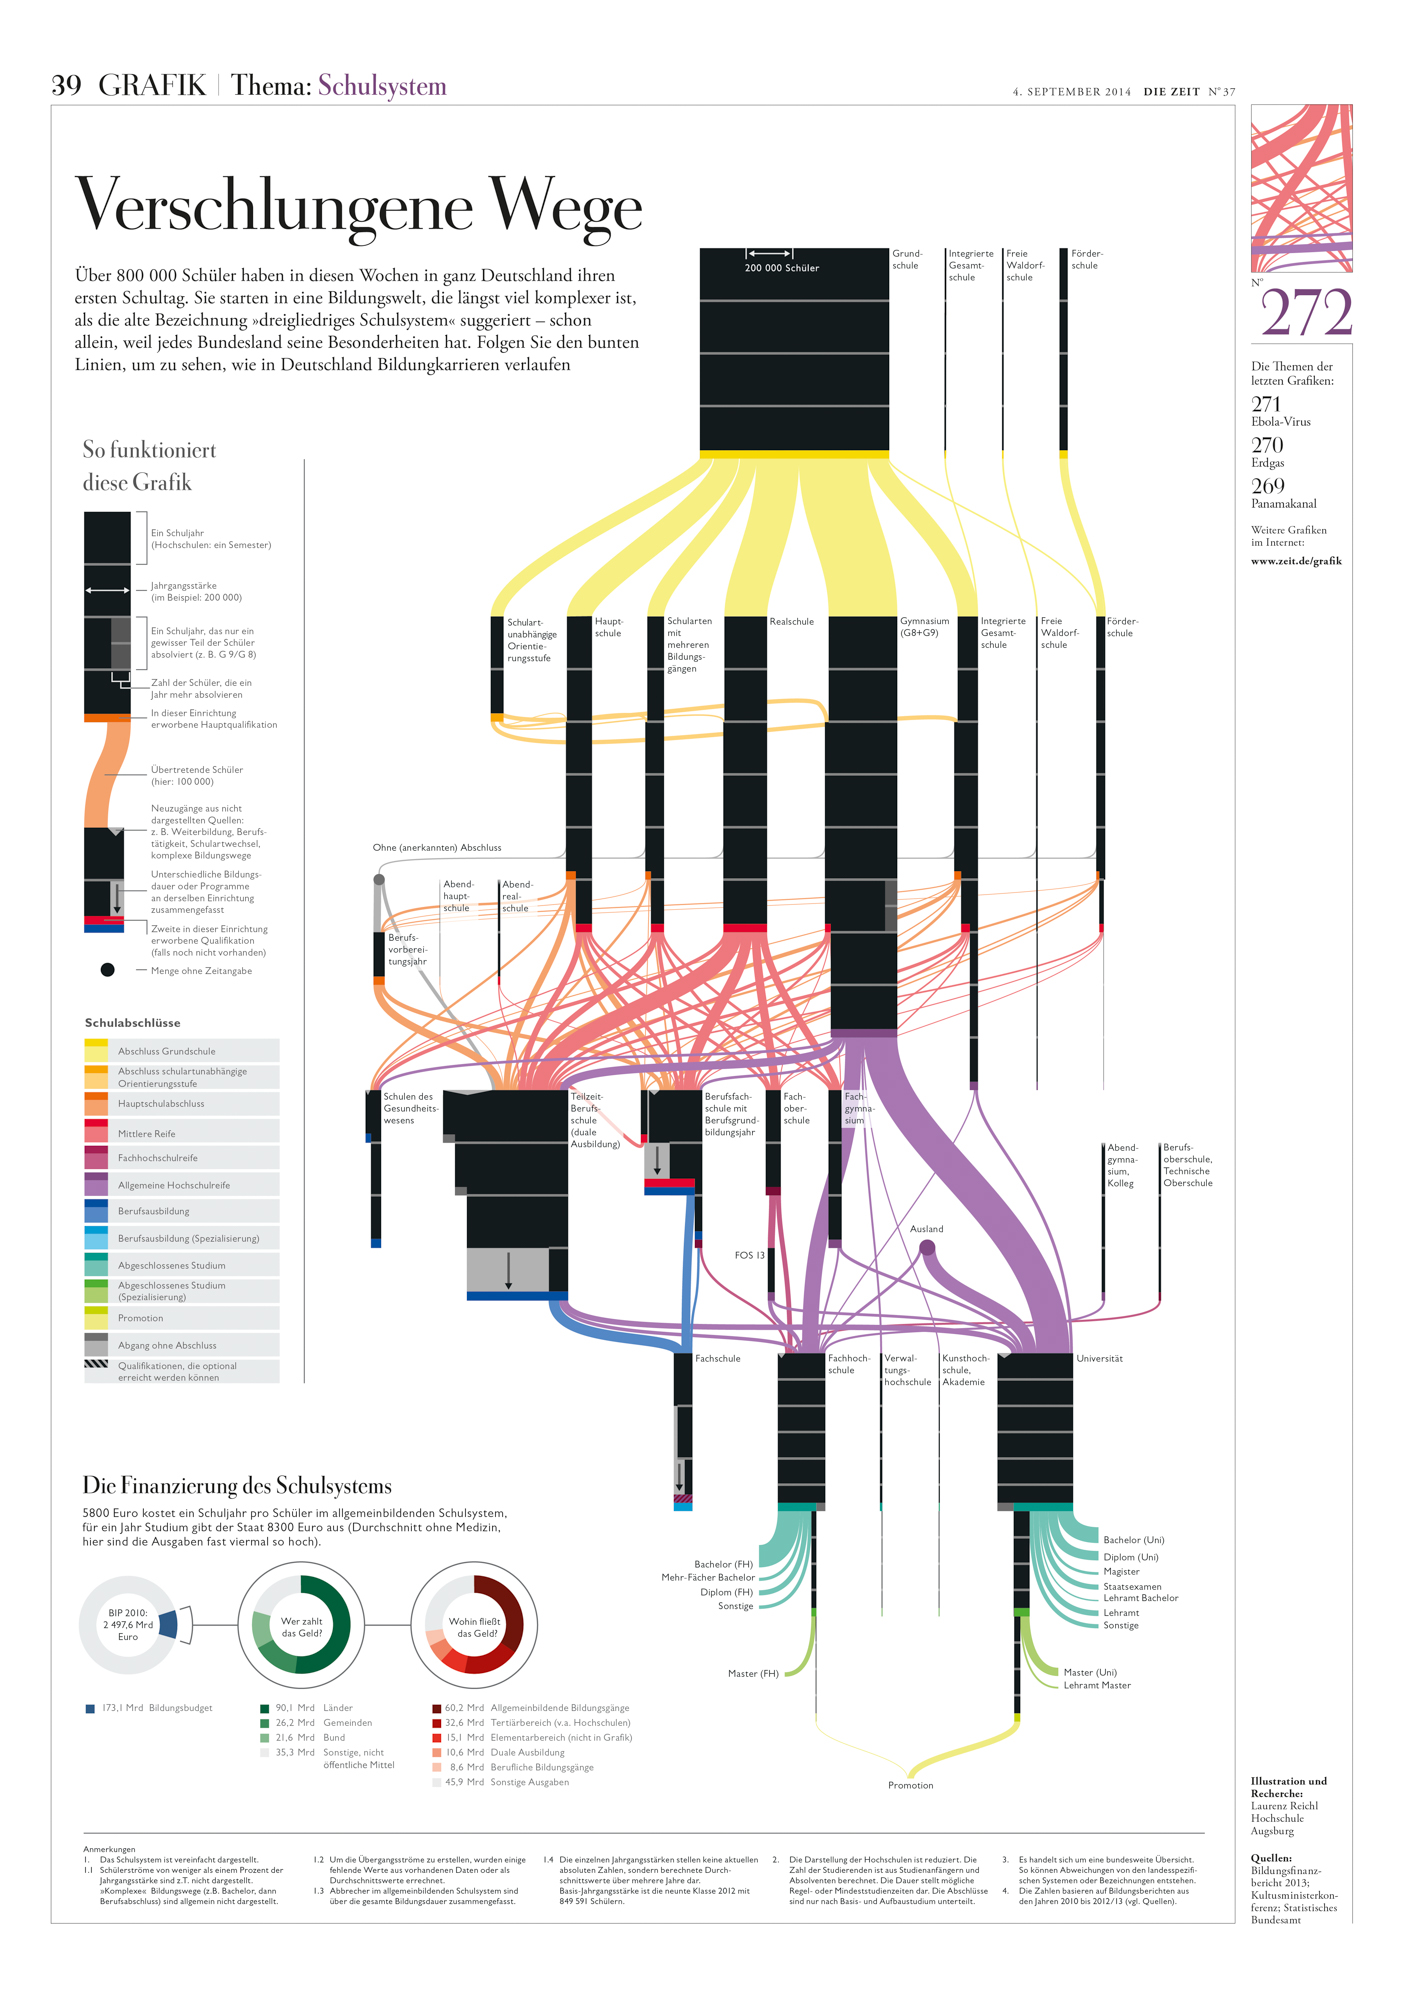
It can also be found here: Zeit – Schulsystem Infografik
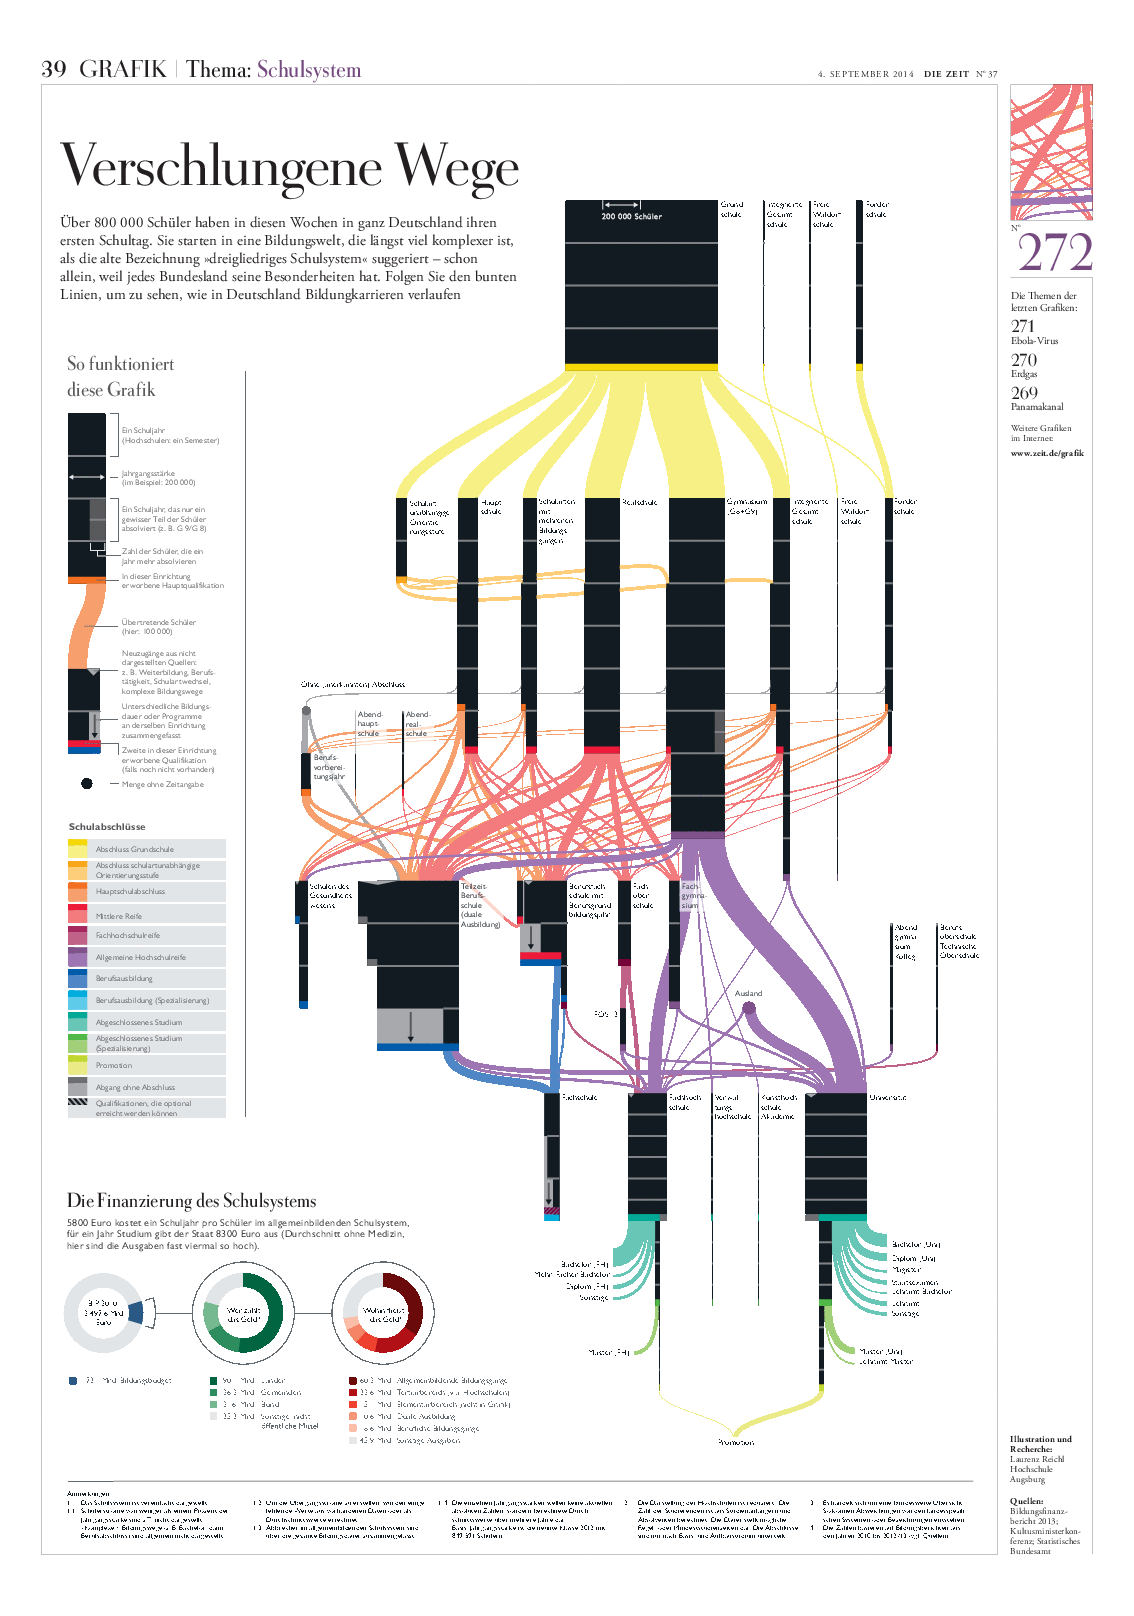
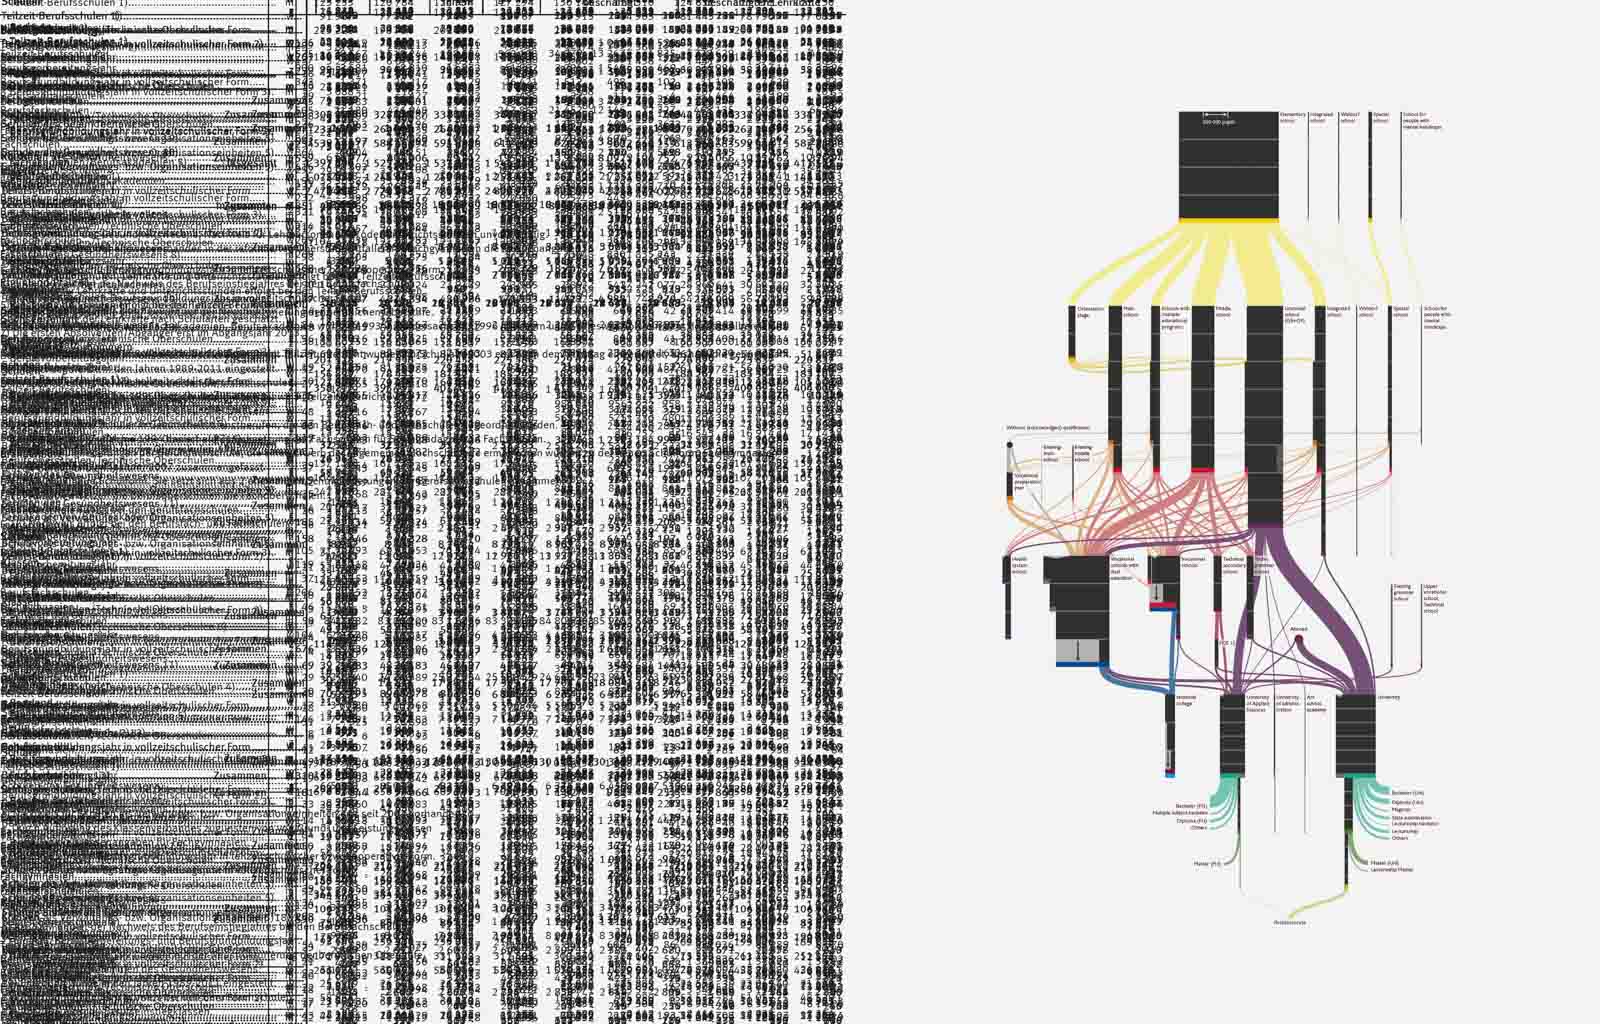
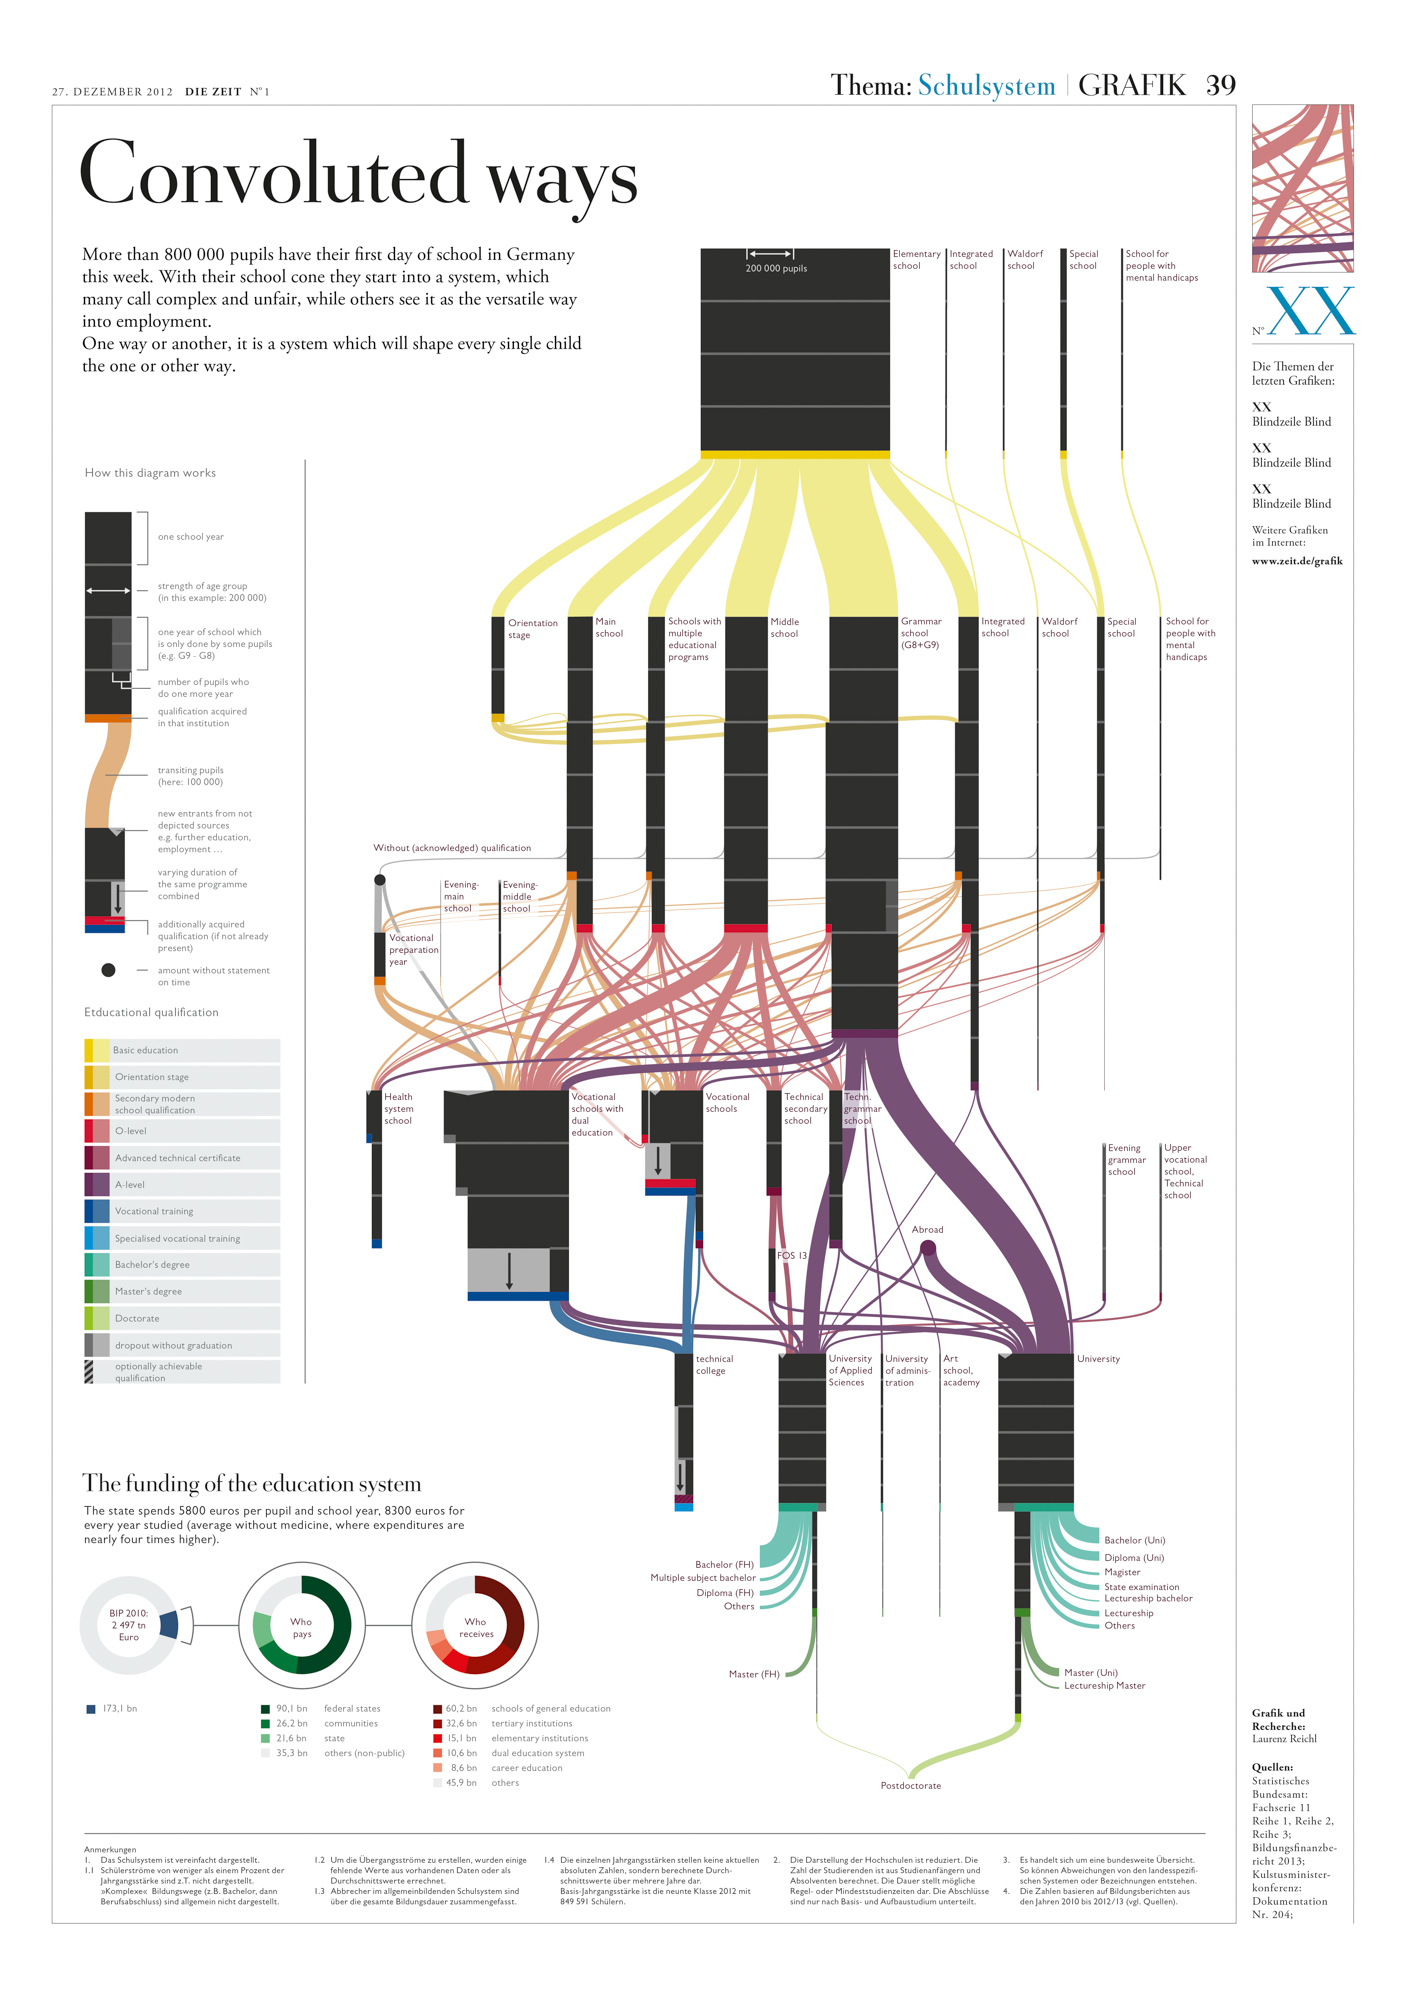
The graphic shows the complexity and versatility Germany's school system. With the paths‘ thickness representing the different institutions‘ frequentation, the own school career is put in proportion with the careers of about 800 000 other students who start school in Germany each year.
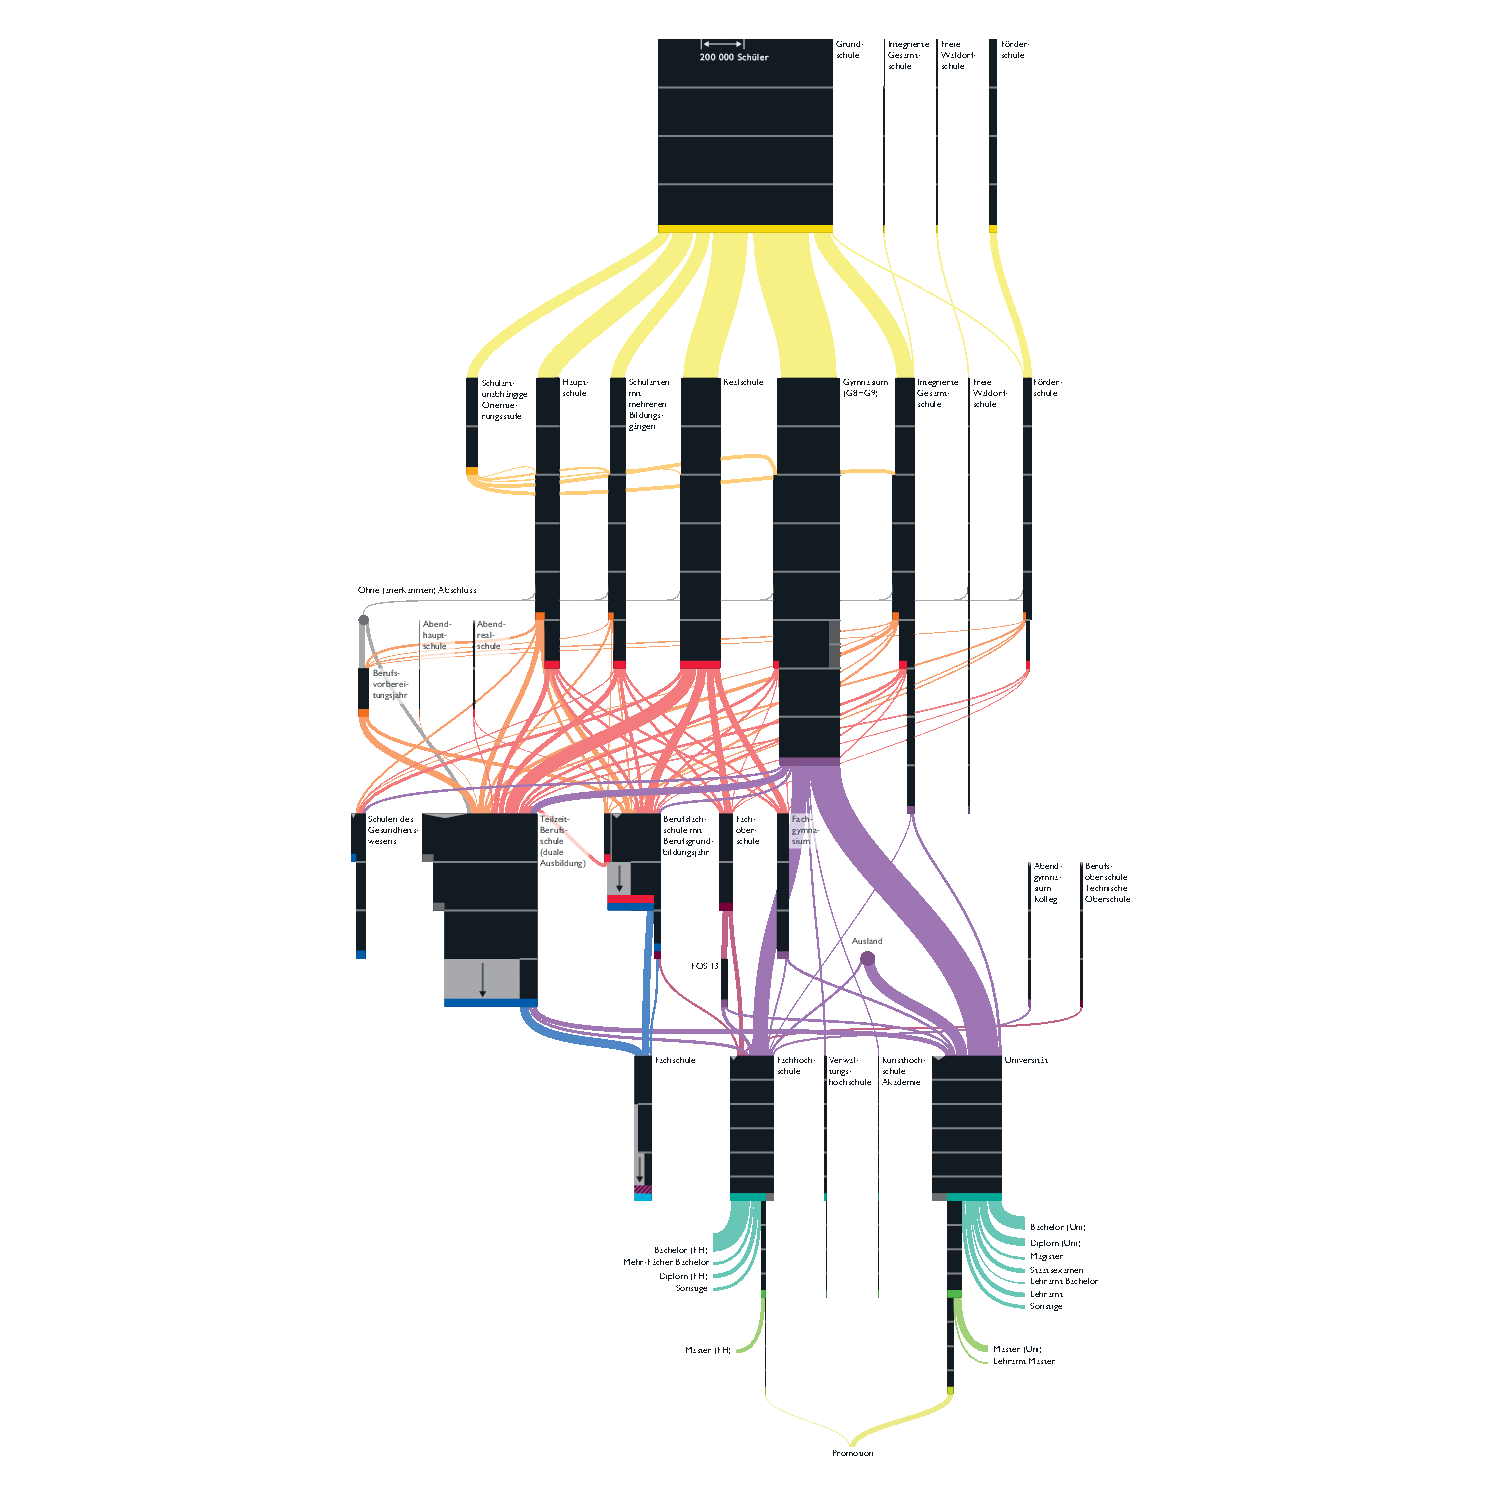
The central Sankey-Diagram shows every pupils way through the whole German school system, giving an impression of why some might call it overly complex while others praise it's versatility.
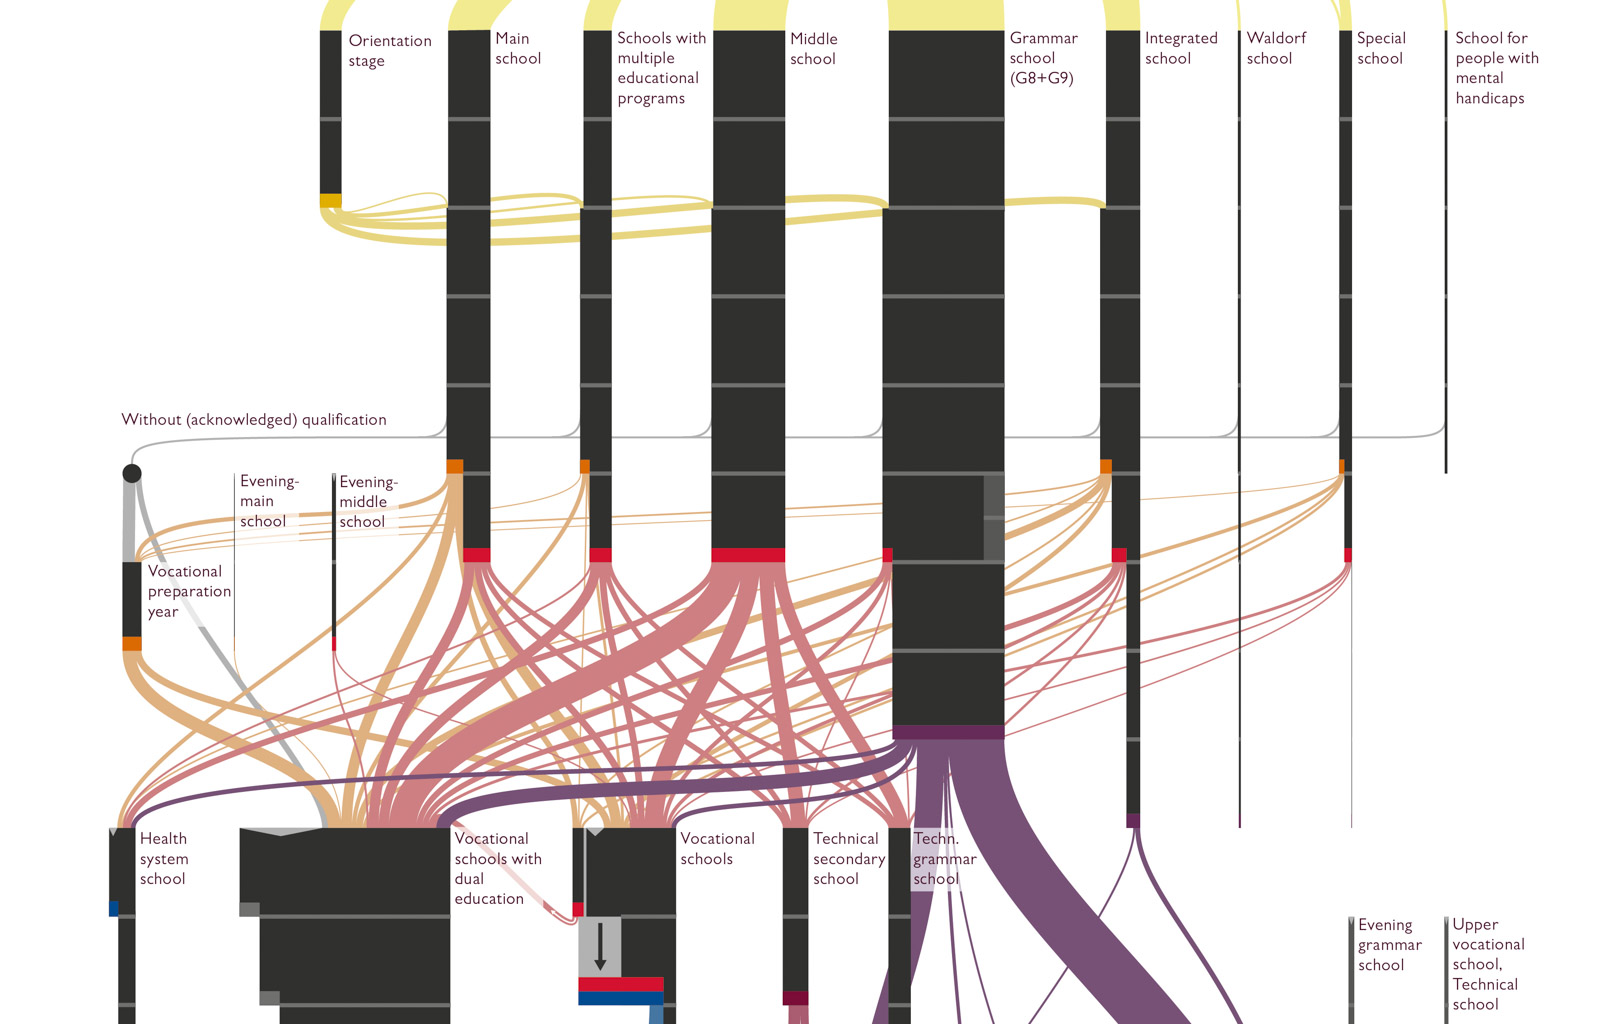
The visualisation heavily relies on scales and colour keying. While the vertical axis renders the years of attendance, the width of the paths illustrates the number of pupils choosing each path. The colour is used to show the highest degree of the students taking each path.

